
Study Report: Finding a broadly popular political policy platform
Updated: Jul 21
What’s the point of politics? Thomas Hobbes gave probably the most famous answer: according to him, political entities (chiefly the nation state) exist to give us an escape from the lawless “state of nature”, which he described as a war of all against all, wherein life is “solitary, poore, nasty, brutish, and short.”
But there are more optimistic views out there. Instead of arguing (like Hobbes) that politics is primarily for the avoidance of harm, Aristotle and Confucius argued that the purpose of politics is to establish the conditions for human flourishing.
It’s a nice idea, that the purpose of politics is to make all our lives better. Yet, watching politics play out in the world today, it can seem like constant bickering and fighting make progress and improvement impossible. Empirical evidence supports this: researchers frequently find that party polarization is a key cause of legislative “gridlock” or “stasis”, that inhibits the passage of laws, regulations, and budgets even more than divided government does. Even when something happens, it's often one party shifting things one way only to have it shifted back by the opposing party soon afterward, in an incredibly costly game of tug-of-war.
All of this conflict makes it seem like there's nothing that different political groups can all agree on: they simply differ too much in terms of what they want the world to be like, and what they think is true.
But what if that's wrong?
We wondered:
Is it possible to develop a platform of policies that are liked by people all across the political spectrum in the US - that is, progressives and centrists and conservatives?
If so, what are these policies?
What would this platform look like?
Could someone run on this platform, or is it for some reason untenable?
So we ran two large studies to find out. We focused on the US context.
Honestly, we weren't sure whether we would find anything worth reporting on, since groups are so polarized. But, we were happy to discover a variety of popular and unpolarized policies that have the potential to improve people’s lives and even garner support from voters. To whet your appetite, here’s a sample of the policies we found were widely supported and that people said would make them want to vote for someone:

This provides evidence that, instead of spending all one’s political energy fighting on axes where people vehemently disagree, it is possible to seek improvements on axes where people agree, and thereby more easily make society better and better.
Of course, some fights really are warranted and important (we’re not saying politicians should never fight over policy!), but it’s possible that in all the fighting, we’re missing out on a great deal of low-hanging fruit in the form of widely-appealing policies that could make people’s lives better. Read on to discover what we found.
In reading this, you might also discover more about your own views, such as policies you support that you've never thought about before.
Study 1: Finding Popular Policies
We started by drafting a long list of policy ideas that we thought might stand a chance of being popular with people regardless of party (even though we didn’t personally agree with all of them). We brainstormed ideas ourselves, crowdsourced from social media, and even asked LLMs for suggestions. We settled on a list of 195 different ideas, including things like:
Ban Legislator Stock Trading (Prohibit senators and representatives from trading stocks to avoid conflicts of interest)
Ban Non‑Compete Agreements (Make most employer–employee non‑compete clauses illegal to promote labor mobility and innovation)
Make Assisted Dying Legal (Allow patients to seek physician‑assisted assistance in ending their life so long as they do so willingly and with sound mind)
Since there are people who believe that (as the philosopher Jeremy Bentham put it), “Every law is an evil, for every law is an infraction of liberty” we made sure that our proposals contained a mix of positive proposals for new laws or regulations and also negative proposals to remove existing laws or regulations. If you’re interested, you can download the full list here.
Our goal was to include a very wide range of ideas that had at least some chance of being widely viewed as good (whether or not we thought they were good), but of course, the list was far from exhaustive, and it's likely we missed some great ideas.
Study 1 was designed to whittle the list down to just the most promising ideas - which we then used in a second, larger study. Here’s how Study 1 worked.
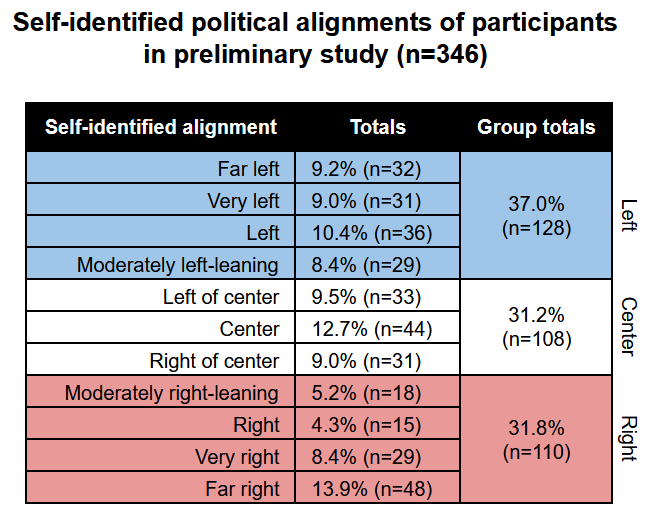
We recruited participants in the United States through our sister project — participant recruitment platform (Positly.com). Each prospective participant was asked to place themselves on a left-right political spectrum, and we made sure to roughly balance the number of participants from the left, center, and right of that spectrum. This resulted in 346 participants being included in the study. Here’s the breakdown of their political alignments:
Each participant was shown a random 75 of the 195 policy proposals in the preliminary study. For each proposal they were shown, they saw:
The policy name
A short description of the policy
And two short arguments in favor of it
They were then asked, “To what extent are you in favor of this policy becoming law or regulation in the US?” Participants gave their answers by selecting options on a 7-point Likert scale from “Extremely in favor” (coded as 3) to “Extremely against” (coded as -3). Here is an example of what this looked like:

We then asked participants a series of demographic questions about their political leanings, religiosity, class in society, and how urban/rural the place is where they live.
We calculated the average score that each policy got from people in each of the three ideological groups: Left, Center, and Right. We then moved forward into our second, larger study with all and only the policies that the Left, Center, and Right were all more than “slightly in favor” of becoming law / regulation, on average. That is, the policies for which the lowest of the three ideological group’s averages was above 1.
How many policies would you expect this to be? Part of the reason we included so many policies in our preliminary study is that we thought widely-popular policies might be very hard to find. If so, that would give reason to expect that there are not many policies for which all group averages were above 1. Well, we were shocked to discover that 95 of our potentially popular policies were popular enough to move forward into our second study. That’s a lot of promising policy ideas! We’ve listed them all in Appendix A.
Study 2: Finding a Non-Partisan Popular Political Platform
Our preliminary study left us with 95 policies that the Left, Center, and Right were all at least “Slightly in favor” of. Once we eliminated two that were too similar to others, that left us with 93 potential policies. As a sanity check and a point of comparison, we also added four questions designed to be emblematic of policies that are popular with only one side of the political spectrum (while disliked on the other side). Those policies were, on the progressive side:
Gun control: Universal background checks, a 'red flag' law, ban assault weapons and high-capacity magazines, require safe storage.
Expand legal migration: ensuring that children who came as dependents on their parents’ temporary visas can remain in the United States with their families (even after turning 21) and increasing the number of immigrant visas that are available by 250,000 over 5 years.
And on the conservative side:
End birthright citizenship to U.S.-born children of undocumented or temporary-status parents.
Ban schools from teaching radical topics by cutting public funding for any school teaching Critical Race Theory, Gender Theory, or other topics deemed inappropriate or radical.
These are real policy proposals, taken from official party platform documents for the 2024 general election (the Democrat platform document is here, the Republican one is here) and Executive Order 14160. Once these were added, we had 97 policies to investigate (93 candidates, and 4 politicized comparisons).
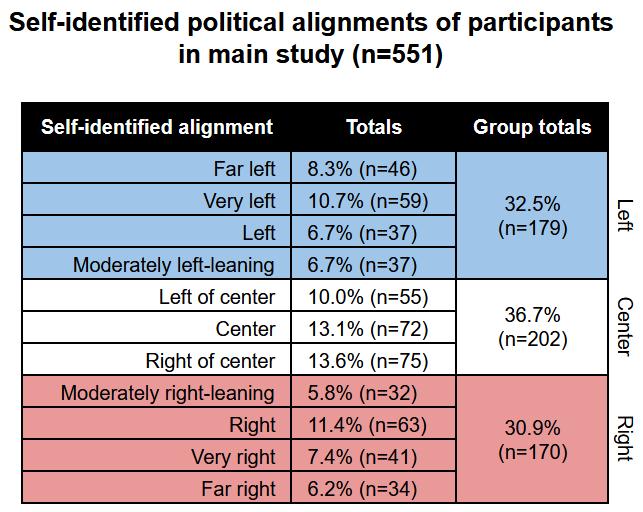
For our main study, we recruited 551 participants (again, via Positly.com) with the following ideological breakdown:
All participants were shown a random 60 of the 97 policy proposals and asked two questions about each one:
How much are you in favor of this policy becoming law or regulation in the US?
To what extent would seeing a political candidate advocate this policy make you want to vote for them (regardless of party)?
The second question was added because we wanted to find policies that are broadly liked and that people will take into account when deciding who to vote for. This matters because politicians can't run on a platform unless it will garner votes.
Imagine you think a policy sounds good and you support it in theory, but it’s not particularly important to you and so won't impact who you vote for – in such cases, you might answer the first question positively, but the second question much less positively.
For both questions, participants gave their answers by selecting options on a 7-point Likert scale. For question 1, the scale went from:
“Completely in favor” (coded as 3) to “Completely against” (coded as -3).
For question 2, the scale went from:
“Greatly increase my desire” [to vote for that candidate] (coded as 3) to “Greatly decrease my desire” [to vote for that candidate] (coded as -3).
Here is an example of what this looked like:

As an additional test, we also randomly assigned each participant to one of two experimental conditions: one condition group was shown arguments for and against each policy, while the other was not. For each participant who was shown arguments, it was randomized whether they were shown the arguments in favor before or after the arguments against.
We then asked participants a series of demographic questions about their political leanings, religiosity, class in society, and how urban/rurally they live.
Results
Let’s go through the most important things we found.
Remember that we were looking into policies that are broadly liked, across the political spectrum. To measure how much a policy is broadly liked across the political spectrum, we used a variable that we called “minimum group appeal,” which is defined as follows: for each policy, its minimum group appeal is the lowest number from among (a) the average of the answers given by people classified as Left, (b) the average of the answers given by people classified as Right, and (c) the average of the answers given by people classified as Center, to the question “To what extent would seeing a political candidate advocate this policy make you want to vote for them (regardless of party)?”
This can be expressed formally as:

Where:
MGAₚ is the minimum group appeal for policy p
L, C, and R are the ideological groups Left, Center, and Right (respectively), and
Vg,p is the mean of responses among ideological group g for policy p to the question: “To what extent would seeing a political candidate advocate this policy make you want to vote for them (regardless of party)?” such that g ∈ {L,C,R}.
Thus, a policy can only have a high minimum group appeal if it is not disliked on average by any of the three ideological groups.
Result 1: What were the best performing non-partisan policies?
So, what does a non-partisan political platform look like? One that transcends partisan boundaries and appeals to people from the Left, Center, and Right. The image below shows the 28 policies we identified that each had a minimum group appeal of 1 or greater, meaning that even the least receptive ideological group reported that seeing a candidate advocate the policy would increase their likelihood of voting for them (at least “slightly”).
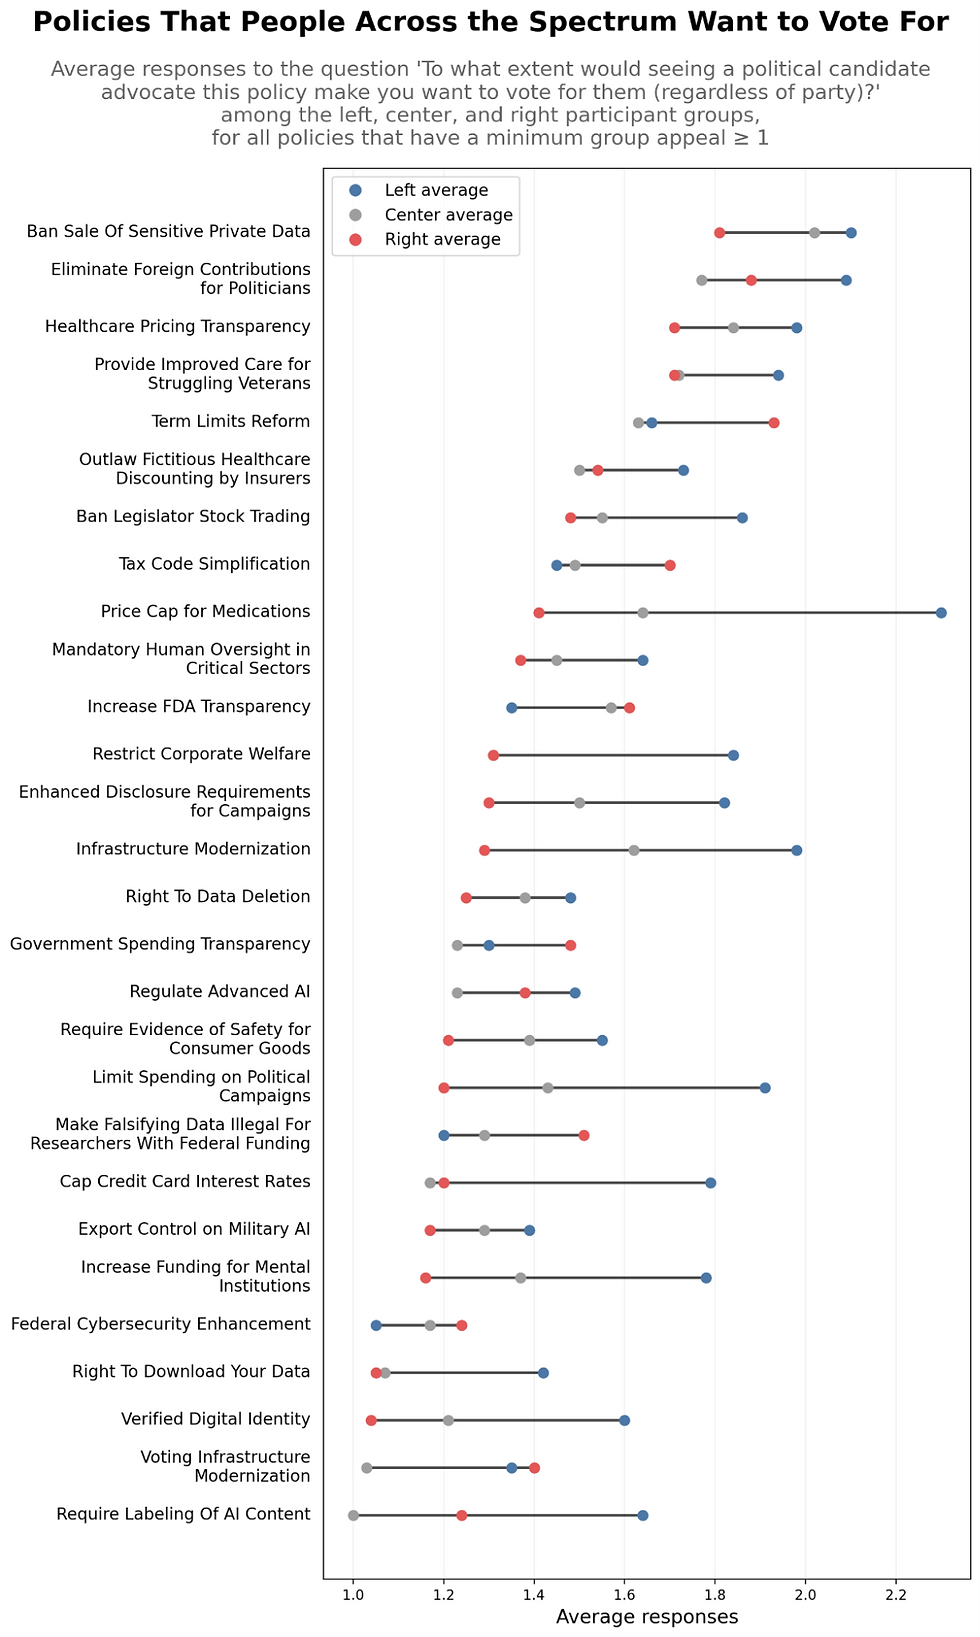
Above are the “policies that all groups want to vote for.” They represent candidates for a potentially viable non-polarized political platform; ways it may be possible to make society or people’s lives better while reducing the gridlock of polarized politics.
Result 2: Which categories were most appealing across the spectrum?
We assigned each of the policies we examined in this study a category. Some categories performed better than others, as shown in this chart:
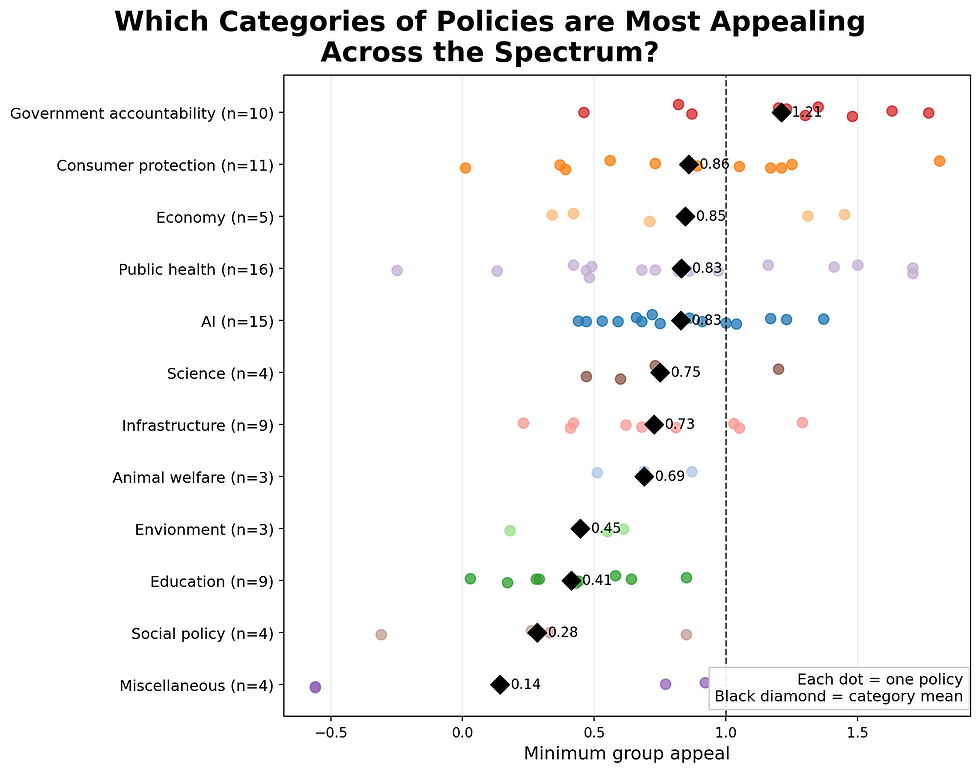
Each colored dot to the right of the dashed line (at x=1) represents a candidate policy that is included in our “policies that people across the spectrum want to vote for,” chart from the previous section (Figure 3). Of course, the line could have been drawn elsewhere, but a (somewhat arbitrary) choice had to be made.
This analysis excludes the four paradigmatically partisan policies we included as a sanity check, because those policies’ minimum averages were (by design) exceptionally low outliers.
This shows that, when it came to thinking of policies that could motivate people across the political spectrum to vote for a politician, we had the most success with policies in the Government Accountability category, followed by Consumer Protection, Economy, Public Health, and AI.
The fact that policies in other categories had lower minimum group averages (as well as category means) might be because US Americans really do generally agree more on the higher scoring topics and less on the lower scoring ones. Alternatively, it might be because we simply failed to generate non-partisan, highly and broadly appealing social, education, environmental, or animal welfare policy ideas; no policies from those categories made it into our “policies that all groups want to vote for” list. We believe that finding widely supported policy proposals in these categories is a worthwhile endeavor for future research. If you have ideas, feel free to email them to us, at info@clearerthinking.org - we’d be interested to hear them!
Result 3: Did being shown arguments affect the outcomes?
As mentioned, each participant was randomly assigned into one of two experimental groups:
Those in the pros and cons group were shown two brief arguments in favor and two brief arguments against each policy, before being asked to give their responses.
Those in the control group were not shown arguments for and against the policies (though just like the other group, they saw a description of the policy)..
We used the following mixed-effects model to predict participants’ mean response, based on whether participants were in the pros and cons group or not, while accounting for the fact that some participants are generally more extreme than others, and some policies naturally elicit stronger reactions than others:

Where response is the value of the answer given to the question “To what extent would seeing a political candidate advocate this policy make you want to vote for them (regardless of party)?”, and in_pros_and_cons_group is the variable that records whether the participant was assigned to the pros and cons group (in_pros_and_cons_group = 1) or the control group (in_pros_and_cons_group = 0).
The results of this analysis indicate a small but statistically significant reduction in response associated with being assigned to the pros and cons group (β = −0.16, p = 0.005). This means that participants who were shown pros and cons gave responses that were (on average) around 0.16 points lower on the response scale (which ranges from -3 to 3) than those who were not shown pros and cons, after accounting for differences between participants and policies. A plausible explanation for this is that perhaps being shown arguments for and against something tends to slightly temper people’s responses to it. However, the 95% CI barely excludes zero [-0.273, -0.047], suggesting substantial uncertainty about the effect size.

When policies get picked up by politicians and incorporated into their political platforms, those policies tend to get debated — which means people get exposed to arguments for and against those policies. Hence, these results give reasons to wonder whether the policies we’ve identified would be less popular or less vote-incentivizing once they make it into a real policy platform. However, since the effect size is very small, it is unlikely that this would reliably or substantially undermine the usefulness of the results of this study.
Limitations regarding what policies would be viable
We sought to find policies that are broadly liked, across the political spectrum, because we theorized that they could provide easy ways to improve people’s lives, without encountering the usual stasis faced by more partisan policies. This relies on the assumption that, for any given policy, if people across the political spectrum would (on average) vote for a candidate supporting a given policy, then that policy is likely to face fewer challenges in becoming law. In reality, at least the following two kinds of problems could undermine this assumption:
1. For any given policy, there might be reasons other than its polarizing nature that cause lawmakers to delay or frustrate its passage into law.
We expect this to be the case with some of the policy proposals we have highlighted in this article. For instance, any policies that would impose greater scrutiny on or accountability for lawmakers are likely to face challenges from those very lawmakers, regardless of how polarized the policy is among the voting public.
Similarly, politicians face pressures from volunteers, wealthy donors, and their own political parties, and those forces can push them to support or oppose specific policies, whether or not they have broad public support.
Despite these concerns, we think it is worth investigating anyway; even if such policies would face frustration from lawmakers, it is interesting to discover (as our results suggest) that candidates running on platforms that include such policies would be likely to gain increases in public support across the political spectrum.
2. It could be the case that the only reason these policies aren’t highly polarized, partisan policies is that they haven’t yet been advocated loudly by politicians. Perhaps, as soon as a Democrat or Republican sticks their flag in any of these policies, those policies will become divisive and thereby face the usual delays.
In support of this concern, there is decades of experimental evidence (also discussed here) suggesting that people use “party cues” (such as the policy positions advocated by the leader of their preferred party) as important determinants of their views on policy. However, the most comprehensive scholarly review of the literature to date reports that more recent studies (which don’t have some of the methodological flaws of older studies) consistently find that “party cues do affect [people’s] views of the policy under consideration–but, on average, information about the policy matters more.” This suggests that, although politicians might be able to have some negative effects on people’s views of currently-popular policy, they won’t typically be able to eliminate those policies’ broad appeal altogether. Hence, there is still practical usage to identifying policies with broad cross-ideological appeal, even in a highly polarized political environment.
Finally, another limitation of the studies presented here is that they relied on the imaginations of a handful of researchers, crowdsourcing, and LLMs to draft potentially popular policy proposals. It’s possible that some of the findings discussed in the Results 2 and Results 3 sections would be slightly different under a different set of policies. To that end, we’d love to see this research replicated with other policy sets.
What does this all mean?
The main findings of this research have been that:
There really are policies that have broad popularity, across the political spectrum, with people from the Left, Center, and Right all reporting that seeing a candidate advocate such policies would increase their desire to vote for that candidate.
When it comes to having broad agreement, some categories of policy may perform better than others. We had the most success finding policies with a high minimum group appeal in the Government Accountability category, followed by Consumer Protection, Economy, Public Health, and AI. We found it more difficult to identify non-partisan, highly and broadly appealing social, education, environmental, or animal welfare policies.
Showing people arguments for and against policies may have a tempering effect on their reactions, but it appears to be a small effect.
Modern political discourse seems to be constantly dominated by highly divisive, highly polarized issues. Yet our findings give reason to think that, even in this political climate, there may still be many opportunities for making people’s lives better through policies that enjoy near-unanimous group-level approval. Some fights are absolutely worth having, but it may be useful to remember that instead of only tugging the rope of politics back and forth, we can seek out sources of agreement about what's good and, in so doing, more easily obtain more of what some have called the purpose of politics: human flourishing.
Appendix A: Rankings for the top 95 Policies in Study 1
Here, we present the top 95 policies from our preliminary Study 1, ranked by highest minimum of averages (from among the Left average, Center average, and Right average). The full list of all 195 policies and their averages can be downloaded here.
Policy name in study | Left avg. | Center avg. | Right avg. | Grand avg. | Min of avgs |
Require Labeling Of AI Content | 2.27 | 2.38 | 2.20 | 2.28 | 2.20 |
Enhanced Disclosure Requirements for Campaigns | 2.78 | 2.26 | 1.97 | 2.34 | 1.97 |
Verified Digital Identity | 2.26 | 1.92 | 2.00 | 2.06 | 1.92 |
Tax Code Simplification | 1.91 | 2.00 | 2.05 | 1.99 | 1.91 |
Cap Credit Card Interest Rates | 2.24 | 2.00 | 1.91 | 2.05 | 1.91 |
Export Control on Military AI | 1.90 | 1.90 | 2.11 | 1.97 | 1.90 |
Healthcare Pricing Transparency | 2.60 | 2.57 | 1.88 | 2.35 | 1.88 |
Federal Cybersecurity Enhancement | 2.45 | 2.16 | 1.86 | 2.16 | 1.86 |
Ban Sale Of Sensitive Private Data | 2.78 | 2.64 | 1.85 | 2.42 | 1.85 |
Mandatory Human Oversight in Critical Sectors | 2.34 | 1.84 | 2.02 | 2.07 | 1.84 |
Increase FDA Transparency | 2.67 | 2.43 | 1.84 | 2.32 | 1.84 |
Provide Improved Care for Struggling Veterans | 2.32 | 2.13 | 1.82 | 2.09 | 1.82 |
Right To Data Deletion | 2.62 | 2.55 | 1.82 | 2.33 | 1.82 |
Right To Download Your Data | 2.43 | 2.23 | 1.81 | 2.16 | 1.81 |
Eliminate Foreign Contributions for Politicians | 2.53 | 2.58 | 1.80 | 2.31 | 1.80 |
Make Unlocking Cell Phones Legal | 1.80 | 2.02 | 1.80 | 1.87 | 1.80 |
Expand Broadband/Internet Access | 2.27 | 2.07 | 1.78 | 2.04 | 1.78 |
Mandatory AI Output Citation | 2.33 | 1.77 | 1.98 | 2.02 | 1.77 |
Require Labeling of Side Effect Frequency | 1.84 | 1.77 | 1.98 | 1.86 | 1.77 |
Simplify Tax Payment Processes | 1.98 | 2.02 | 1.76 | 1.92 | 1.76 |
Aging Infrastructure Upgrades | 2.28 | 2.31 | 1.73 | 2.10 | 1.73 |
Infrastructure Modernization | 2.32 | 2.21 | 1.69 | 2.07 | 1.69 |
Price Cap for Medications | 2.61 | 2.23 | 1.68 | 2.17 | 1.68 |
Government Spending Transparency | 1.95 | 2.31 | 1.67 | 1.97 | 1.67 |
Regulate Advanced AI | 2.02 | 1.75 | 1.66 | 1.81 | 1.66 |
Require Open Data For All Studies Receiving Federal Fundings | 2.10 | 1.66 | 2.04 | 1.93 | 1.66 |
Make Falsifying Data Illegal For Researchers With Federal Funding | 1.96 | 2.23 | 1.64 | 1.94 | 1.64 |
Climate Resilience Projects | 2.37 | 1.98 | 1.64 | 1.99 | 1.64 |
Outlaw Fictitious Healthcare Discounting by Insurers | 2.72 | 2.29 | 1.63 | 2.22 | 1.63 |
Apply Animal Cruelty Laws to Farms | 2.23 | 1.81 | 1.63 | 1.89 | 1.63 |
Expand National Parks | 2.19 | 1.62 | 2.00 | 1.94 | 1.62 |
Ban Legislator Stock Trading | 2.56 | 2.24 | 1.58 | 2.13 | 1.58 |
Voting Infrastructure Modernization | 1.87 | 1.58 | 1.80 | 1.75 | 1.58 |
AI Antitrust Regulations | 1.95 | 1.57 | 1.74 | 1.76 | 1.57 |
Streamlined Solar Permitting | 2.11 | 1.74 | 1.56 | 1.80 | 1.56 |
Wastewater Tracking of Disease | 2.20 | 1.56 | 1.74 | 1.84 | 1.56 |
Healthy School Meal Programs | 2.35 | 1.56 | 1.67 | 1.86 | 1.56 |
Increase Funding for Mental Institutions | 2.18 | 1.54 | 1.82 | 1.85 | 1.54 |
Lower-Cost Child Adoption | 1.98 | 1.61 | 1.54 | 1.71 | 1.54 |
Enhanced Mental Health Hotlines | 2.00 | 1.62 | 1.54 | 1.72 | 1.54 |
Improve Monitoring of Drug Effects | 2.05 | 1.77 | 1.54 | 1.78 | 1.54 |
Outlaw Gerrymandering | 2.46 | 2.02 | 1.51 | 2.00 | 1.51 |
AI Licensing for Intellectual Property Use | 1.62 | 1.49 | 1.71 | 1.60 | 1.49 |
Ban Autonomous Weapons | 2.39 | 1.69 | 1.48 | 1.85 | 1.48 |
Restrict Corporate Welfare | 2.18 | 1.92 | 1.48 | 1.86 | 1.48 |
Ban Cramped Cages for Egg-Laying Hens | 2.08 | 1.63 | 1.48 | 1.73 | 1.48 |
Universal Provision of Basic Necessities | 2.25 | 1.47 | 1.76 | 1.83 | 1.47 |
Limit Spending on Political Campaigns | 2.34 | 2.43 | 1.47 | 2.08 | 1.47 |
Urban Green Corridor Initiative | 2.18 | 1.61 | 1.47 | 1.75 | 1.47 |
Eliminate Tax Loopholes | 2.33 | 1.92 | 1.46 | 1.90 | 1.46 |
Put an Age Cap on Holding Political Office | 1.61 | 1.68 | 1.44 | 1.58 | 1.44 |
Improve City Air Quality | 2.56 | 2.09 | 1.43 | 2.03 | 1.43 |
STEM Education Investment | 2.00 | 1.83 | 1.41 | 1.75 | 1.41 |
Remove Laws Preventing Reporting Animal Abuse at Farms | 1.87 | 1.66 | 1.41 | 1.64 | 1.41 |
Academic Integrity AI Detection Tools | 1.85 | 1.40 | 1.57 | 1.60 | 1.40 |
Require Evidence of Safety for Consumer Goods | 1.94 | 1.62 | 1.37 | 1.65 | 1.37 |
Increase Federal Minimum Wage | 2.56 | 1.65 | 1.36 | 1.86 | 1.36 |
Misinformation Liability Rules | 2.10 | 1.41 | 1.36 | 1.62 | 1.36 |
Digital Literacy Initiative | 1.94 | 1.51 | 1.36 | 1.60 | 1.36 |
Ban on Lethal Autonomous Weapons | 2.44 | 1.65 | 1.36 | 1.81 | 1.36 |
Ban on Mass Biometric Surveillance | 1.53 | 1.35 | 1.41 | 1.43 | 1.35 |
Ban Viral Gain-of-Function Research That Poses Potential Human Threat | 1.33 | 1.76 | 1.70 | 1.60 | 1.33 |
Term Limits Reform | 1.33 | 1.55 | 1.56 | 1.48 | 1.33 |
Disallow Cryptocurrency Creators From Selling/Scamming Shortly After Launch | 2.40 | 1.90 | 1.33 | 1.87 | 1.33 |
Change Daylight Saving Time Policy | 1.41 | 1.31 | 2.00 | 1.57 | 1.31 |
Free Addiction Treatment | 2.10 | 1.31 | 1.58 | 1.67 | 1.31 |
Increase Non-partisan Science Funding | 1.74 | 1.31 | 1.75 | 1.60 | 1.31 |
Free Temporary Conditional Housing | 2.18 | 1.30 | 1.58 | 1.69 | 1.30 |
Food Waste Reduction Incentives | 1.91 | 1.49 | 1.30 | 1.57 | 1.30 |
Large Cash Prizes for Dementia or Alzheimer's Treatments | 1.28 | 1.56 | 1.83 | 1.56 | 1.28 |
Ban Random Spam Calls | 1.49 | 1.54 | 1.28 | 1.44 | 1.28 |
Ban Overdraft Fees at Banks | 2.08 | 1.26 | 1.30 | 1.55 | 1.26 |
Ban Multi-Level Marketing Companies When Most Sales Are to Their Own Distributors | 2.00 | 1.63 | 1.26 | 1.63 | 1.26 |
Standardized Performance Metrics for Federal Programs | 1.25 | 1.38 | 1.69 | 1.44 | 1.25 |
Require Letters From Businesses To Have Easy Unsubscribe Links | 1.80 | 1.24 | 1.70 | 1.58 | 1.24 |
Expand Walking and Cycling Trails | 1.97 | 1.93 | 1.22 | 1.71 | 1.22 |
Free School Breakfast and Lunch for Children in Public Schools | 2.42 | 1.50 | 1.21 | 1.71 | 1.21 |
Identify Gifted Youth From Poor Backgrounds and Provide Free Advanced Education | 1.82 | 1.21 | 1.51 | 1.52 | 1.21 |
Economic Incentives for Not Replacing Humans With AI | 1.51 | 1.21 | 1.43 | 1.38 | 1.21 |
Free Pre-Kindergarten Programs | 2.30 | 1.19 | 1.50 | 1.66 | 1.19 |
Reduce Sugar and Corn Subsidies | 1.43 | 1.19 | 1.62 | 1.41 | 1.19 |
Transparent AI Tuning and Value-Setting Process | 1.94 | 1.18 | 1.78 | 1.63 | 1.18 |
Community Childcare Centers | 2.13 | 1.41 | 1.17 | 1.57 | 1.17 |
Allow Treatments to Be Given Across State Lines | 1.16 | 1.34 | 1.51 | 1.34 | 1.16 |
Provide a Path for Long‑Time Illegal Immigrants to Get Citizenship | 2.16 | 1.21 | 1.15 | 1.50 | 1.15 |
Public Transit Microgrants | 2.04 | 1.14 | 1.36 | 1.51 | 1.14 |
Provide Free Internet Access for All Low-Income Families | 1.98 | 1.14 | 1.35 | 1.49 | 1.14 |
Ban Non‑Compete Agreements | 1.46 | 1.14 | 1.33 | 1.31 | 1.14 |
Ban Cell Phones in Schools | 1.08 | 1.31 | 1.61 | 1.33 | 1.08 |
Gender Pay Equality | 2.43 | 1.27 | 1.08 | 1.59 | 1.08 |
Don't Allow Training of AI on Copyrighted Materials | 1.79 | 1.20 | 1.08 | 1.35 | 1.08 |
Don't Require Prescriptions for Glasses and Contacts | 1.26 | 1.12 | 1.07 | 1.15 | 1.07 |
AI-Focused Education and Retraining Grants | 1.18 | 1.05 | 1.46 | 1.23 | 1.05 |
Incentivize Bicycle Use | 1.58 | 1.02 | 1.03 | 1.21 | 1.02 |
Provide Universal Healthcare for Only the Most Proven and Cost‑Effective Treatments | 1.56 | 1.02 | 1.31 | 1.29 | 1.02 |
Appendix B: Averages of All Policies that Increase Reported Voting Desire of Ideological Groups at least “Slightly”
Policy name | Left avg. | Center avg. | Right avg. | Min of avgs | Max of avgs |
Ban Sale Of Sensitive Private Data | 2.1 | 2.02 | 1.81 | 1.81 | 2.1 |
Eliminate Foreign Contributions for Politicians | 2.09 | 1.77 | 1.88 | 1.77 | 2.09 |
Healthcare Pricing Transparency | 1.98 | 1.84 | 1.71 | 1.71 | 1.98 |
Provide Improved Care for Struggling Veterans | 1.94 | 1.72 | 1.71 | 1.71 | 1.94 |
Term Limits Reform | 1.66 | 1.63 | 1.93 | 1.63 | 1.93 |
Outlaw Fictitious Healthcare Discounting by Insurers | 1.73 | 1.5 | 1.54 | 1.5 | 1.73 |
Ban Legislator Stock Trading | 1.86 | 1.55 | 1.48 | 1.48 | 1.86 |
Tax Code Simplification | 1.45 | 1.49 | 1.7 | 1.45 | 1.7 |
Price Cap for Medications | 2.3 | 1.64 | 1.41 | 1.41 | 2.3 |
Mandatory Human Oversight in Critical Sectors | 1.64 | 1.45 | 1.37 | 1.37 | 1.64 |
Increase FDA Transparency | 1.35 | 1.57 | 1.61 | 1.35 | 1.61 |
Restrict Corporate Welfare | 1.84 | 1.31 | 1.31 | 1.31 | 1.84 |
Enhanced Disclosure Requirements for Campaigns | 1.82 | 1.5 | 1.3 | 1.3 | 1.82 |
Infrastructure Modernization | 1.98 | 1.62 | 1.29 | 1.29 | 1.98 |
Right To Data Deletion | 1.48 | 1.38 | 1.25 | 1.25 | 1.48 |
Regulate Advanced AI | 1.49 | 1.23 | 1.38 | 1.23 | 1.49 |
Government Spending Transparency | 1.3 | 1.23 | 1.48 | 1.23 | 1.48 |
Require Evidence of Safety for Consumer Goods | 1.55 | 1.39 | 1.21 | 1.21 | 1.55 |
Limit Spending on Political Campaigns | 1.91 | 1.43 | 1.2 | 1.2 | 1.91 |
Make Falsifying Data Illegal For Researchers With Federal Funding | 1.2 | 1.29 | 1.51 | 1.2 | 1.51 |
Cap Credit Card Interest Rates | 1.79 | 1.17 | 1.2 | 1.17 | 1.79 |
Export Control on Military AI | 1.39 | 1.29 | 1.17 | 1.17 | 1.39 |
Increase Funding for Mental Institutions | 1.78 | 1.37 | 1.16 | 1.16 | 1.78 |
Right To Download Your Data | 1.42 | 1.07 | 1.05 | 1.05 | 1.42 |
Federal Cybersecurity Enhancement | 1.05 | 1.17 | 1.24 | 1.05 | 1.24 |
Verified Digital Identity | 1.6 | 1.21 | 1.04 | 1.04 | 1.6 |
Voting Infrastructure Modernization | 1.35 | 1.03 | 1.4 | 1.03 | 1.4 |
Require Labeling Of AI Content | 1.64 | 1 | 1.24 | 1 | 1.64 |
Supplementary Materials
Study 1 (Preliminary study):
Supplementary Material 1: List of 195 policy proposals, with descriptions and arguments in favor
Supplementary Material 2: Survey used
Supplementary Material 3: Anonymized data
Supplementary Material 4: Data dictionary (for Supplementary Material 3)
Supplementary Material 5: List of 195 policies and the following averages for each: Left average, Center average, Right average, Grand average, Min of averages
Study 2 (Main study):
Supplementary Material 8: List of 97 policy proposals, with categories, descriptions, and arguments for and against
Supplementary Material 9: Survey used
Supplementary Material 10: Anonymized data
Supplementary Material 11: Data dictionary (for Supplementary Material 10)
Supplementary Material 12: Results


