What best predicts how fatigued you’ll be? We ran a huge study to find out
- Gregory Lopez
- Feb 16, 2021
- 19 min read
Updated: Feb 19, 2021
Fatigue not only feels bad, but it is also connected with a host of negative outcomes like decreased cognitive performance and increased accident risk. If you experience tiredness or fatigue regularly, it's worth trying to understand it better. There are some indications that tiredness is a massive problem. A survey by the National Safety Council found that 76% of Americans say they feel tired at work, with 39% saying they have trouble remembering things at work because of fatigue. Because we think this is an important problem, we ran a very large study to help increase understanding of what factors contribute to making people tired.
We set out to investigate which factors best predict how tired people feel at a given moment in time.
How we studied fatigue
The first step was to study fatigue was to figure out exactly what we meant by fatigue! We could not find an existing scale that we felt was satisfactory for understanding how tired people at a given moment, so we developed a general fatigue score that aimed to get at four different aspects of fatigue and tiredness, with these questions:
“How tired does your body feel right now?”
“How tired does your mind feel right now?”
“How slow and sluggish are you right now?”
“How awake do you feel right now?"
We ended up publishing this scale in an academic journal as the Fatigue State Questionnaire. The scale measures each of four aspects on a scale of 0 to 4, where 0 means “Extremely” and 4 means “Not at all”. We combined respondents’ answers to these four questions to generate a single overall fatigue score (adding the first three questions together and then adding four minus the last question since it goes in the opposite direction).
We also designed a survey that asked a lot of questions about things that seemed like they might have some ability to predict fatigue or tiredness, attempting to cover a very wide range of possibilities. The questions related to things that fell into a few general categories:
Demographic information — For instance, age and body mass index.
Sleep patterns and tiredness trends — We asked how tired the participants were 5 minutes after waking, after getting 2 nights of full sleep, and how much sleep they ideally need.
Recent behaviors that could affect tiredness — Did they exercise that day? Were they listening to music when taking the survey? Were they doing a boring activity 5 minutes before starting the survey?
Recent consumption of things that could affect tiredness — When was the last time they ate or drank, and what did they eat? When was the last time they consumed caffeine, and about how much did they take in? Have they consumed other stimulants or drugs that day?
Illness that could contribute to fatigue — Do they have any illnesses that could contribute to fatigue?
Sleep — Approximately how much sleep for the past two nights?
Time of day — What was the time of day they took the survey?
Anxiety levels — a combination of four different questions that measure current anxiety. Each question was scored on a 0-4 scale just like the tiredness questions above. They were also combined to a single anxiety score just like the tiredness score, too, adding the anxiety related scores to 4 minus scores related to calmness or relaxation. The specific statements the participants were presented with were:
“I feel worried right now.”
“I feel tense right now.”
“I feel calm right now.”
“I feel relaxed right now.”
These questions yielded a total of 37 quantitative dependent variables to explore. We also collected some qualitative data relevant to some of these categories.
With the survey in hand, we then recruited participants to fill it out, collecting a total of 1,846 responses.
How we analyzed the data
With so many variables to explore, our first step to look was to split off 150 randomly chosen participant responses and hold those on the side (our "validation data"), in order to test the validity of our model down the road.
Next, we transformed some of the variables for a couple of different reasons. The first was to test for nonlinearity in some of the terms we suspected could have a nonlinear influence on tiredness (e.g. hours slept per night might have increasing large effects on fatigue the closer you get to 0). The second was to approximate caffeine blood levels more accurately by using an exponential decay function coupled with the average half-life of caffeine in order to see if this estimate had any correlation with tiredness.
From there, we took two approaches with the aim of finding a good model that predicts tiredness. Our first approach was by hand; we took a look at the correlation coefficients between the general fatigue score and each variable individually to see what variables showed initial promise for predicting fatigue.
Using these individual correlation coefficients as a guide, we then built a regression model adding one variable at a time (so we could compare the relative influence of each variable more directly). During this process, we looked for what variables boosted the R-squared (a measure of predictive accuracy) of the fit, and the statistical significance of each variable added to the regression, starting with the variables that had the highest correlation coefficients and working from there.
Finally, once we built the model, we tested its predictive value on the 150 data points we put aside to start, seeing how good a fit we achieved, as an unbiased estimate of our model's accuracy.
However, we wanted to make sure that this by-hand approach didn’t introduce bias, so we also created an automated model-generating procedure that performed the following steps:
Fit one variable at a time to the training data, and choose the one with the biggest r-squared with respect to the training data.
Fit this model to the test data to get a test r-squared.
If the test r-squared increases (which it does by definition on the first round), keep the variable, and repeat the process with the remaining independent variables plus all the other variables kept from the previous rounds until the test r-squared no longer increases.
What we found out
In the end, of the 37 variables we tested for predicting fatigue, only a few of them appeared to have meaningful effects. Some of the variables were important whether we built the model by hand or using the automatic procedure. These were:
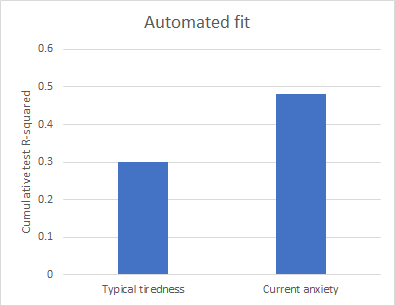
Typical tiredness: how respondents answered the question “On a typical day, how tired or sleepy do you feel throughout the day?” on a scale of 0 to 4, where 0 meant “Extremely” and 4 meant “Not at all”. This variable was highly predictive regardless of whether we built the model manually or automatically.
Current anxiety: the combined score related to agreement with four questions related to anxiety at the time the respondents took the survey, rating each on a scale of 0 to 4:
“I feel worried right now.”
“I feel tense right now.”
“I feel calm right now.”
“I feel relaxed right now.”
Just like typical tiredness, this was a very strong predictor of fatigue regardless of how we built the model.
There were also four specific variables in which our hand-created model and our automated model differed:
Time of day: our automatic model-building didn’t select time of day. However, we included it in our manual model due to its high raw correlation with tiredness along with the fact that it makes sense that people get more tired as the day goes on.
A measure related to how much sleep the person got the previous night: we asked participants when they went to bed and woke up in order to calculate the number of hours they slept the previous night. We also assessed how much sleep they ideally needed by asking them: “What is the ideal number of hours that you personally need to sleep in order to feel your best?” We then had the choice of using one of three metrics for how much sleep the person got the previous night: just the number of hours slept, the number of hours slept minus ideal sleep, or its absolute value. We ultimately chose to use the absolute value of the difference between the number of hours slept the previous night and the ideal hours of sleep needed because we thought it was possible that people can be tired if they get too much sleep as well as too little sleep. It also had the strongest raw correlation of the bunch (0.18 versus -0.08 for hours slept and -0.17 for sleep minus ideal sleep). However, this variable was not chosen by the automated model-building algorithm.
Fatigue-causing illness: a yes or no answer to the question: “Are you currently sick with an illness that could cause fatigue?” We included this in our hand-made model since it was highly correlated with fatigue had a high predictive value in our regression model. However, our automated selection process did not select this variable as important.
Age: We included age in our hand-made model due to its high negative correlation with fatigue coupled with its predictive value. However, the automatic model building process did not select this.
You can check out the variables’ relative influence in both models in the table below. The number is the regression coefficient for the normalized variables (i.e., each variable has its mean subtracted and is divided by its own standard deviation to put it in the same units as the other variables), which allows direct comparison between the magnitudes. Red font indicates that the variable is positively correlated with fatigue, while green font indicates a negative correlation.

The charts below shows how the R-squared of the training regression increased with each additional variable added, along with the p-value of each estimate in the final model:

What the results mean
Both models were able to "explain" over 40% of the variation in how tired a person reports being at a given moment in time. While this means that there is still quite a lot of fatigue at a given moment that the model is unable to explain, it still does a pretty good job. It also allows us to think a bit about why the variables that work could predict part of the variation in tiredness.
Before we proceed exploring the variables a bit more, it’s worth emphasizing the word “predict”. This study was purely observational — in every case, we can only say that these variables were able to help predict overall tiredness. We can’t say for sure that they’re causal. That being said, there are reasons to believe that some of the variables may indeed be causing tiredness. For instance, three variables that have a minor predictive role (having a fatigue-causing illness, time of day (or a measure correlated to it), and how much the participant slept the previous night (relative to their ideal amount) are well known, common sense causes of tiredness, so it’s not too out there to speculate that these are causal.
While we’re on the topic of these three variables, we should note that, while they don’t predict tiredness as strongly as the other two variable we’ll get to soon ("typical tiredness" and "current anxiety"), our confidence that these common-sense variables are doing some predictive work is boosted by the fact that their coefficients in our model all have the sign we’d expect: they’re all positive, which means that they all contribute to being more tired, which makes sense for all three of these variables.
Did age have an effect?
The final minor variable to discuss is age. The automatic variable selection process didn’t select this as a variable, which lowers our confidence in its usefulness. Also, we can’t tell if age is directly influencing tiredness levels, or whether there are confounding variables associated with age that could be influencing fatigue levels.
We did control for two variables in our final model that could plausibly confound tiredness’ association with age: number of hours slept relative to the ideal amount, and typical tiredness. As you can infer by referring back to the table above, controlling for these two variables doesn’t flip the direction of the correlation. In other words, our study suggests that age is negatively correlated with tiredness whether or not hours slept and typical tiredness is controlled for. This means that our model predicts that an older person will be less tired than a younger person, even if they have slept the same amount and had the same level of typical tiredness. This is a pretty surprising result, and one more reason why we don't put much confidence in this variable!
One final note concerning age as a predictive variable is worth mentioning. Our sample tended to skew toward younger adults. The median age of our sample was 35, with the 90th percentile being 57. This means that, even assuming age is useful, our predictions concerning age’s association with overall fatigue are less likely to be reliable for teens and children, as well as older adults. You can check out the age distribution of our sample in the figure below. We expect that if our population had been older, for sufficiently high ages we would have seen more average tiredness with age rather than less.

Next, let’s turn our attention to two variables that did most of the predictive work in both models: typical tiredness, and the participants' current anxiety score.
Typical tiredness: a weird (but important!) predictor
We were concerned about typical tiredness explaining so much, since it seemed that this variable could be highly correlated with some of the others. For instance, a long-term fatigue-causing illness could raise baseline tiredness levels. Also, there's a sense in which it's almost a tautological variable, raising the question of how much it’s actually explaining at the end of the day — “Why am I so tired? Because that’s how I roll!” However, when we removed typical tiredness as a variable, the remaining five measures still had highly significant p-values, suggesting that there’s some explanatory value in the other five variables that don’t tie in with baseline fatigue levels. As for the tautology — we admit that while the variable technically explains a lot, it is a bit mysterious, as there should be underlying factors that contribute to baseline. One way to think about our findings is that your tiredness at a given moment in time (what we were aiming to predict) is predicted by both how tired you are typically (i.e. "typical tiredness") and other factors that have predictive power above and beyond your typical tiredness (e.g. how anxious you feel at that moment, and how much you slept last night).
Why would current anxiety be correlated with tiredness?
The other variable that did a lot of the predictive heavy lifting was current anxiety, which was an aggregate score based on summing four separate questions all aiming to get at different aspects of anxiety to measure how anxious the person was right at that moment. Recall that current anxiety had the second-highest correlation coefficient with tiredness, and its coefficient in the multivariate model trailed only slightly behind typical tiredness. These both imply that it’s a really important predictor of tiredness. It’s again worth emphasizing the word “predictive” here, though, since from this study we can’t tell if anxiety caused tiredness or not. In fact, anxiety’s ability to predict tiredness is consistent with at least four different causal hypotheses:
Higher tiredness levels cause people to feel more anxious (e.g., perhaps tiredness reduces resilience to stress)
Higher present-moment anxiety levels cause people to feel more tired
Anxiety over several hours could lead to a "burn out" effect which can make someone tired, and the correlation between in-the-moment anxiety and tiredness we saw simply reflects this burn out
Current anxiety levels are caused by higher baseline anxiety, which leads to poorer sleep quality or quantity, which leads to higher tiredness (so sleep is really what's relevant here, and anxiety is just a proxy for sleep which effects tiredness)
Since this study is observational, we couldn’t infer which of these hypotheses is correct from this study alone. So we ran an additional randomized controlled trial to tease out these hypotheses a bit more.
Does anxiety cause tiredness?
The second hypothesis could be directly tested through a randomized controlled trial; if we could randomize people to a condition which reduces their anxiety or a control condition that doesn’t, then if tiredness drops in the former group, we can infer that anxiety causes tiredness.
To do this trial effectively, we needed interventions that were known to reliably reduce present-moment anxiety. Fortunately, we had two such interventions from the Mind Ease app: progressive muscle relaxation and visualization (check out the app if you want to try them yourself!). The former walks participants through a process of tensing then relaxing muscles in a stepwise fashion, while the latter guides people in imagining a very relaxing place.
Since we weren’t positive whether one of these methods would be more relaxing than the other, we used both (using a shortened and simplified both exercises slightly for our purposes compared to how they are used in the app). We randomized 416 participants to either progressive muscle relaxation, visualization, or a control group in a 1:1:2 ratio. The control group was asked to do whatever they wanted for the same amount of time the interventions took (around 6 minutes).
We found that both interventions worked to lower anxiety relative to the control group, but that there was no detectable difference in anxiety reduction between them (p=0.52 by t-test) between the progressive muscle relaxation and visualization techniques, meaning they appear to work about as well as each other, so we wound up combining them and comparing them to the control group, which yielded no significant difference in change in tiredness (p = 0.52 by t-test) even though the anxiety reduction interventions did improve anxiety by one point (on the 0 to 16 scale) versus control (p= 3E-5 by t-test).
While at first blush, this made it seem as if anxiety didn’t cause tiredness. However, there was something about the sample which caught our eye: overall, this was a fairly unanxious bunch:
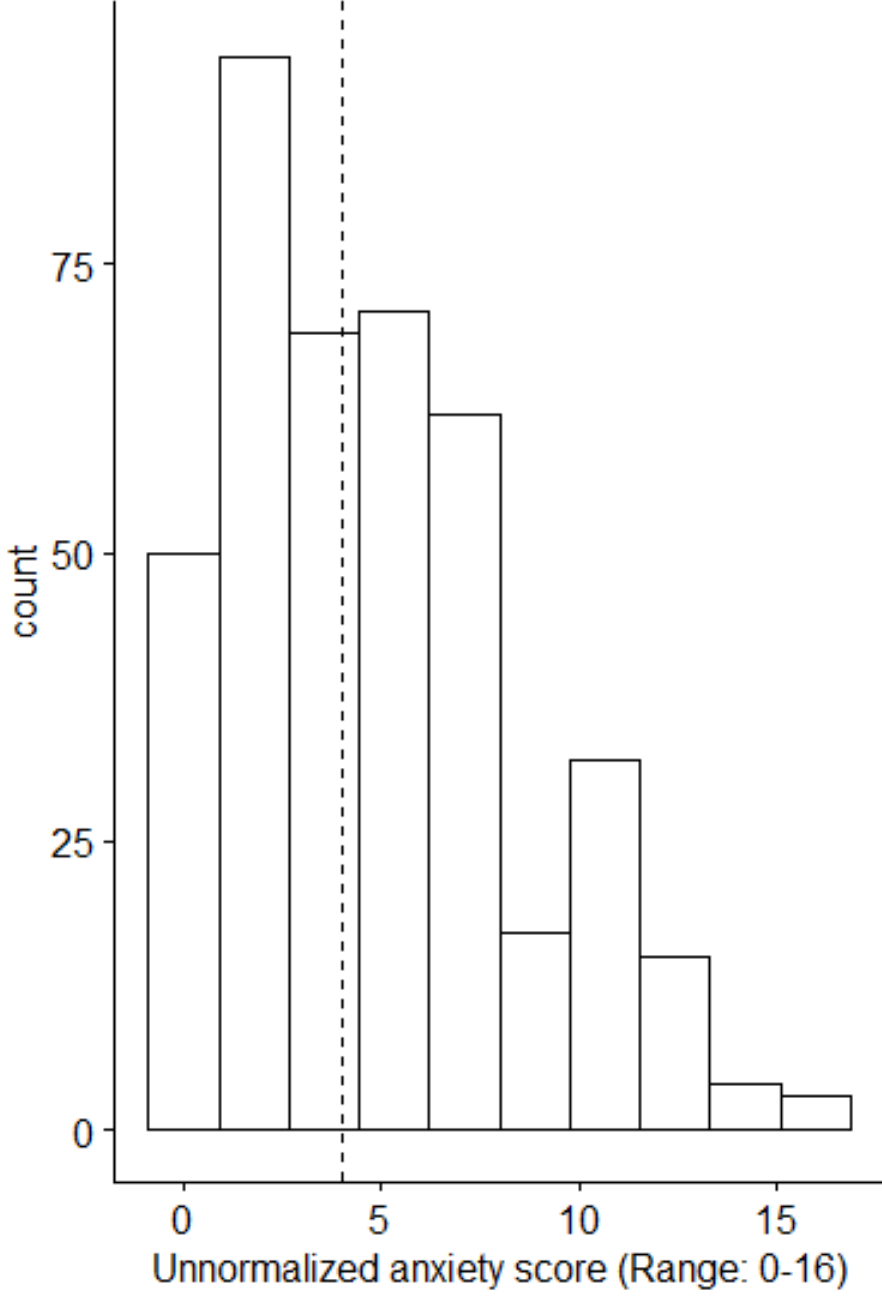
Because of this, we suspected that this didn’t quite falsify the hypothesis that anxiety causes tiredness, since there wasn’t much that anxiety could drop in this relatively calm sample! If someone is barely or not at all anxious at a particular moment, you can't lower their anxiety much, which means you can't test the hypothesis if a drop in anxiety leads to a drop in tiredness in such a person! When we looked at just the subsample of people in the study who started off in the top 50% of anxiety, we did start to see an effect, but the sample size and effect size was too limited to be confident one way or another.
To see if we could find an effect in people with higher anxiety, we repeated the experiment by recruiting 200 people who were asked to only take the study if they were anxious in the present moment. This yielded a more anxious group on average:

Taking a look at this group alone found that fatigue dropped by 1.4 more points in the anxiety intervention group when compared to the control group (p = 5E-5), with anxiety dropping 3.3 points more than the control group (p = 2E-7). A simple linear regression found that anxiety would have to drop by around 3.6 points on the scales we used to reduce fatigue by 1 point out of 16. This means that some’s rating of anxiety in one of our four metrics would have to move from “extremely” to “not at all” or “a little” in order to move their tiredness in one of our four metrics down one level of agreement (e.g., “moderately” to “a little”).
So, it seems that present-moment anxiety has a weak but real causal effect on present-moment tiredness! However, that doesn’t rule out the “burn-out” effect or high baseline anxiety also playing a role. In order to test these hypotheses, we also asked participants how anxious they were over the five hours before they took the study and anxiety last night before bed using the same scale with which we measured present-moment anxiety. We used the GAD-7 to measure trait anxiety over the past two weeks. Since these weren’t manipulated using a randomized trial, any associations found can only be taken as correlational.
What about anxiety burn-out and trait anxiety’s relationship with tiredness?
To test hypothesis 3 (that several hours’ of anxiety could make someone tired by burning them out) we ran a linear regression that controlled for sleep quality, absolute value of the difference between the hours slept and the number of hours ideally needed, typical tiredness, and present-moment anxiety. This yielded a relationship that was not only very weak in magnitude, but also in the opposite direction that would be expected (the coefficient was negative). This, coupled with the fact that the five-hour anxiety coefficient wasn’t quite statistically significant (p=0.10 for the full dataset and p = 0.09 for the high-anxiety subset), makes us suspect that there’s little evidence to support the burn-out effect here.
The evidence seems to be even less consistent with hypothesis 4, which states that current anxiety levels are a symptom of higher baseline anxiety, which could affect tiredness because of poorer sleep quality or quantity. When controlling for the same variables, last night’s anxiety wasn’t correlated with fatigue (p = 0.35 with the high-anxiety subset, p = 0.66 for the full dataset). And when controlling for those same variables plus all other anxiety measures, GAD-7 score has no independent effect on tiredness, either (p = 0.49 for the high-anxiety subset, p = 0.11 for the full dataset).
Putting this all together, it looks like the evidence supports present-moment anxiety causing present-moment fatigue. This evidence is strongest since we were able to test it using a randomized trial. Our data is not consistent with trait anxiety, burn-out, or anxiety last night affecting tiredness independent of sleep time and sleep quality. However, this conclusion is much less certain, given that those results are observational (not the result of a randomized experiment) so it's harder to establish causality in a reliable way.
Some notable negative findings from the main study
So far we’ve mostly focused on the positive predictive findings. But there are also some interesting and surprising negative findings, too. Here are some of the highlights concerning things that we were surprised to find didn’t have a clear relationship with tiredness:
The amount of sleep two nights previously had no clear relationship with tiredness. We asked participants to report how much sleep they got two nights prior to taking the survey. Their responses had no clear relationship to their tiredness levels when they took the survey. This is pretty surprising — we’d expect a relative lack of sleep to affect tiredness levels for a couple of days. The lack of effect could suggest that this simply isn’t the case. Or it could also be due to people not recalling how much they slept two nights ago accurately; if there’s a lot of noise in self-reported sleep recollection, then this wouldn’t be a very useful predictor. There’s some mild evidence for recall bias when comparing the distributions of the number of hours slept two nights ago (which was self-reported) and the number of hours slept the previous night (which we calculated from self-reported sleep and wake times). Since the shapes and means of the two distributions differ, this weakly suggests recall bias.

However, it’s also possible that people’s recall was really accurate, and that our sample was sleep deprived two nights ago on average, and made up some sleep the night before the study. If this were true, we’d expect to see a negative correlation between hours slept two nights ago and the night before. However, when we looked at people who reported getting less than six hours of sleep two nights previously (indicating potential prior sleep deprivation), we actually saw a mildly strong positive correlation (0.31) between the two variables, which is inconsistent with this possibility. It is possible that it really is the case that how tired you feel right at this moment isn't impacted to any significant degree by how much you slept two nights ago.
Food intake had no clear correlation with present-moment tiredness. We looked at several variables related to food intake, including how long it was since the participant last ate, how much they ate, and the rough macronutrient content of the meal. While the automatic selection process did choose the time since last eating as a predictive variable, its p-value was not significant and its coefficient was tiny, which strongly suggests to us that this particular variable isn’t a useful predictor of tiredness. And none of the other variables related to food had clear predictive value, either. This seems to stand in contrast to many people’s subjective experience that large or carb-heavy meals make them feel tired. We found essentially no correlation between whether people said they had eaten at least a "moderate" amount of food the last time they ate, and how tired they were. When we limited it to the small number of people who had eaten a "large" amount of food recently (which is only 25 people), the correlation went in the opposite direction we expected.
Whether or not the participants took a nap that day also didn’t have a clear relationship to present-moment tiredness. We could have imagined this relationship going in either direction. Maybe when you are really tired you take a nap, but that doesn't fully resolve your tiredness, or maybe taking a nap could rejuvenate people to the extent that it makes them less tired than normal. In any event, we didn't find any effect at all of naps on tiredness. Perhaps there just weren't enough nappers in our data set to reliably find this effect. In our sample, there were 134 people who said they had napped that day.
Caffeine intake had no clear influence on tiredness. We examined a binary variable representing whether or not caffeine was consumed, estimates of the amount of caffeine imbibed, the time between taking the survey and the last time caffeine was consumed, and none of these had a clear relationship. We even estimated current caffeine blood levels in those who consumed caffeine by using the average half life of caffeine in an exponential decay function. This wasn’t predictive of tiredness either. A substantial number of people reported consuming caffeine (64%), so the lack of predictiveness probably isn’t accounted for a small sample size. While it’s possible that people who tend to be tired take in more caffeine, so that it balances out, we found almost no correlation between typical tiredness levels and caffeine intake, which speaks against this possibility. Out of all our negative results, this was one of the more surprising ones!
There were no clear nonlinear relationships with tiredness. We expected that some of the variables we measured would have nonlinear relationships with tiredness. For instance, we might expect that for each additional hour you under-sleep, that missing hour is even worse for tiredness than the missing hour before. However, we didn’t find any clear nonlinear effects. Visually inspecting our data suggested that this may be because our data was pretty noisy on the single-variable level, making it hard to tell if there were clear nonlinear effects present. While our sample size was very large, it may be that even more data would be needed to find non-linearities.
A few more caveats
We’ve already mentioned some weaknesses of this study. However, there are also a couple of other caveats to keep in mind.
The first one is that this study heavily relied on self-reported measures for both our predictors and, importantly, for our main outcome of fatigue. This means that if people’s self-reports were not completely accurate, this could lead to lower precision in our estimates, or being off if there’s systematic bias in people’s responses. A prudent interpretation of our results would be that self-reported measures of our final dependent variables predicted self-reported measures of fatigue. That being said, as far as we know, there does not exist a more objective way to measure fatigue than asking people how they feel, and we actually ended up having to develop our own fatigue scale because the other fatigue scales we found did not seem satisfactory for this purpose. Plus, we confirmed that present-moment anxiety was indeed linked to present-moment tiredness by randomized trial, which suggests that these scales are measuring something more than just self-reports; after all, it would be kind of weird for reliable anxiety-reducing techniques to just reduce what people say about fatigue without actually making them feel less tired!
Another caveat also stems from how we recorded self-reported measures. Many of our survey questions, including those measuring tiredness, explicitly focused on asking the participants how they felt at the moment they were taking the survey. This means that this study can’t speak to how these measurements vary over time for each individual. While we attempted to capture anxiety in different time frames in our second substudy, these questions still relied on recall and self-reporting, so could easily be subject to recall error as well.
A third caveat is that we had a lot of freedom when analyzing the results for both the manual process and even the automatic model-building process due to the complex nature of the study and the large amount of variables that were measured. Several judgement calls had to be made along the way, and the data could have been analyzed differently, which could lead to different results. That being said, the sample size we used was very large, and the p-values we obtained were extremely small, suggesting that our findings are very unlikely to be due to random chance. We also validated our model on a hidden validation set that was not used in testing hypotheses. And, most importantly, we gathered experimental evidence supporting a causal link between tiredness and one of its most important predictors: present-moment anxiety!
If you’d like to work with the data yourself, you can download a cleaned-up, anonymized dataset and also check out the R code that was used to derive our main conclusions:
With those caveats in mind, we hope you learned some things about what can predict tiredness, and also how much more there is to explore!