What is a correlation, and how can you think clearly about them?
- Travis M.
- Sep 5, 2024
- 10 min read
Updated: Oct 23, 2025
You’ve probably heard that “correlation is not causation”, but what does that mean? It’s a phrase that captures the fact that, just because two things are correlated doesn’t mean that one causes the other.
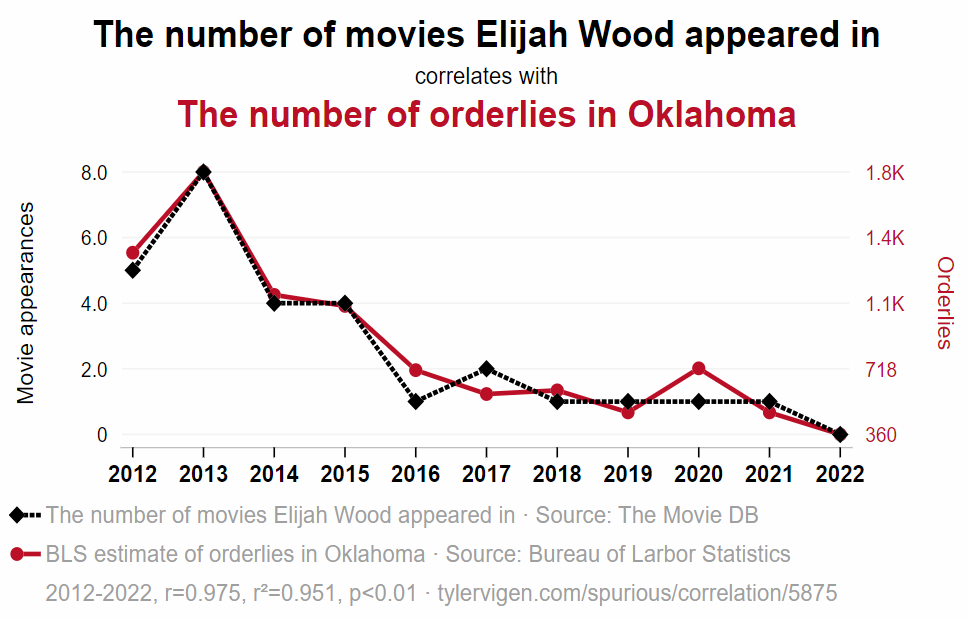
This can be seen most vividly in correlations between things that have clearly got absolutely nothing to do with each other. Such as the 0.975 correlation (that’s very, very strong!) between the number of movies Elijah Wood appeared in and the number of orderlies in Oklahoma, between 2012 and 2022.

(Souce of this graph and other amusing, spurious correlations.)
These two things clearly have not got enough to do with each other for there to be a causal link at work here. Yet people will often assume that a high correlation between two phenomena indicates an effect of one on the other.
This week, we’re going to help you understand correlations a bit better. Doing so can help you to avoid being duped or misled in a variety of ways. For instance:
Avoid mistakenly inferring causation where there is none
Avoid being duped into thinking there are connections between unrelated things
Avoid neglecting important hidden factors
Avoid exaggerating relationships
Avoid mistakes about how generalizable correlations are
This article starts by explaining what correlations are. If you want to skip ahead to some lessons for thinking critically about them, jump to the section ‘Common Correlation Thinking Traps’.
What is a Correlation?
A correlation is a number between -1 and 1 that expresses the strength and direction of the relationship between two phenomena. You can think of it as a way to quantify how much (or how little) two things are related.
A positive correlation means that as one phenomenon increases (according to whatever measure you’re using), so does the other (on average).
A negative correlation, on the other hand, means that as one phenomenon increases, the other tends to decrease (on average).
And if there’s no correlation at all, as one goes up the other neither goes up nor down on average - this happens, for example, when there is no relationship at all between the two
For example, imagine you’re tracking your daily coffee intake and your productivity at work. If you find that the more coffee you drink, the more tasks you complete, you might have a positive correlation on your hands. On the flip side, if more coffee leads to jitteriness and less focus, you might notice a negative correlation.
Maximum and minimum correlations (+1 and -1)
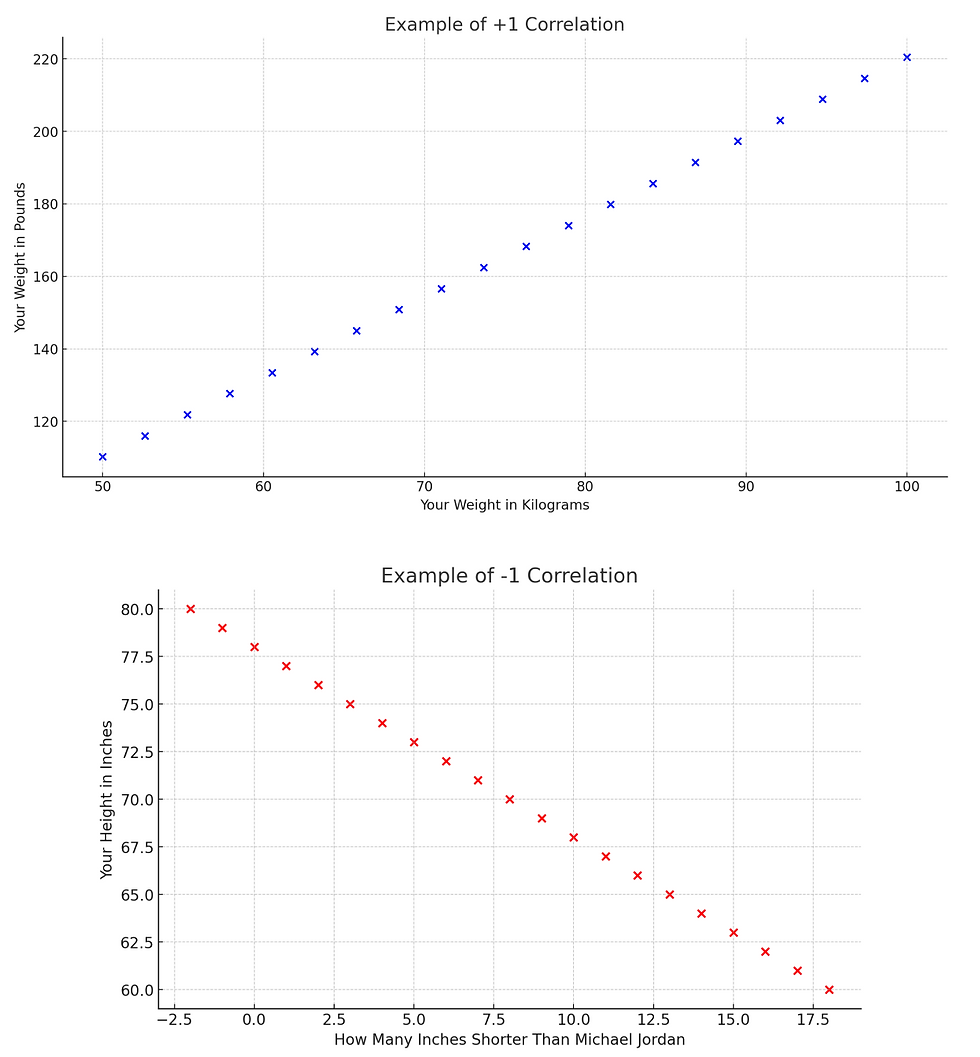
If the points for two phenomena on a chart fall perfectly along a line rising upward, the correlation is 1. An example is the relationship between individuals' weights in pounds and in kilograms (which are the same thing, just represented in different units).
On the other hand, if the points fall perfectly along a line falling downward, the correlation is -1. An example is the relationship between individuals' heights (in inches) and "the number of inches they are shorter than Michael Jordan". This indicates a perfect inverse relationship, meaning as one thing increases, the other decreases proportionally.

For every additional inch of height that you have, you are one inch LESS short than Michael Jordan.
No correlation: 0
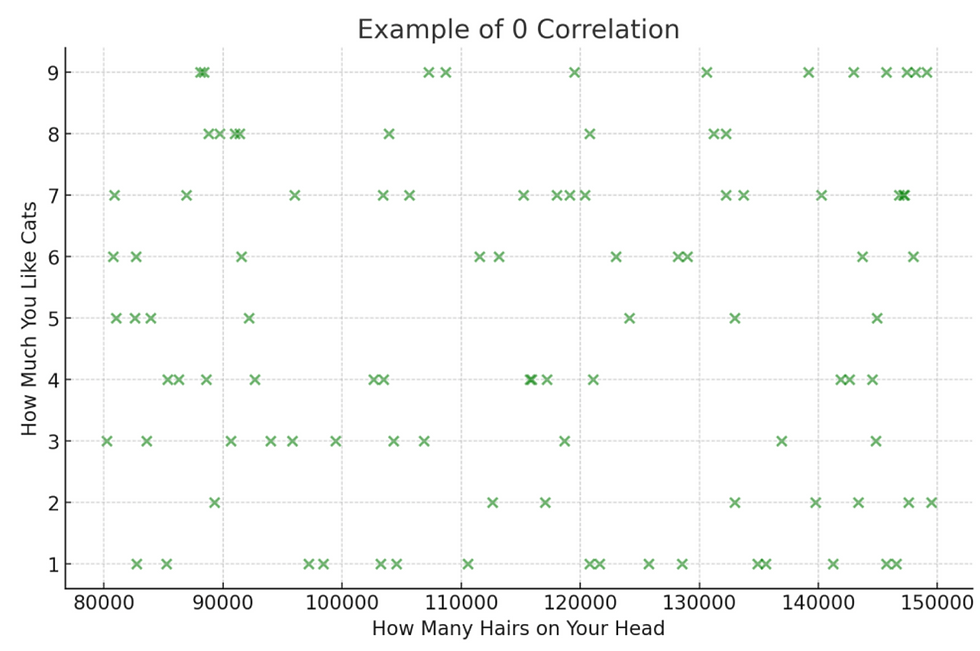
If the points form a cloud of random dots, with no trend at all up or down, the correlation is roughly 0. An example is the relationship between the number of hairs on individuals' heads and how much they like cats, which are two wildly unrelated metrics. As the number of hairs on your head goes up, on average the amount you like cats neither goes up nor down — unless, of course, you're counting cat hairs!

Test your knowledge! Q1: What's the correlation between your age and the number of years that have passed since you were born?
Answer (highlight the white space to reveal): A person's age and the years that have passed since their birth are the same thing, so the correlation is 1. |
Beyond Perfect Scores
Almost always, correlations are not exactly -1, 0 or 1, but instead they fall somewhere in between. The farther a correlation is from 0 (i.e., the closer the correlation is to -1 or +1), the ‘stronger’ the relationship is.
The top chart in the image below shows a moderate-to-strong correlation between agreeing with "I yell at people" and "I lose my temper" (look at the blue ‘x’s). However, the relationship isn't perfect (i.e., it's not 1), meaning that you cannot entirely predict responses to one statement based on the other. While the blue ‘x’s tend to follow the red trend line, they don't follow it perfectly.
The bottom chart in the image below shows that people who agree they "love a good fight" tend to disagree with the statement "I'm civilized, not barbaric". Yet the relationship isn't perfect (i.e., it's not -1) — suggesting that even the most civilized among us might have a chance of having a hidden gladiator inside them.

Note: These graphs are merely illustrative, with a small number of data points for simplicity. In practice, an analysis of this kind would typically have many more points - but throughout this article we limit the charts to have a small number of data points to make them easier to understand.
Test your knowledge! Q2: What's the correlation between the extent to which people agree with these two statements? "I have recently failed to pay my debts" and "I feel satisfied with my income"
Answer (highlight the white space to reveal): People who failed to pay their debts are less likely to feel satisfied with their income, which is reflected in a moderately-negative correlation (-0.37). It's not -1 because debt failure is not the only reason people can be unsatisfied with their income, and even people who are satisfied with their income may occasionally fail to pay a debt. Q3: What's the correlation between responses to these two questions: "How many dogs do you have?" and "What day of the week were you born in?"
Answer (highlight the white space to reveal): How many dogs you have has nothing to do with what day of the week you were born in, so the correlation is close to 0. |
Common Correlation Thinking Traps
Now that we know what correlations are, let’s turn our focus to thinking critically about them. Here are 5 common ways that people end up going wrong in their thinking about correlations, and how you can avoid getting snared by the same thinking traps.
1. Confusing correlation and causation
Let’s start with the most obvious. As was illustrated in the introduction to this article, just because two things are correlated doesn’t mean that one causes the other.
Here’s another example: After polling revealed that viewers of Fox News scored lower than other demographics on a quiz of political knowledge questions, Rolling Stone concluded that “Watching Fox News Makes You Stupid”. In doing so, Rolling Stone inferred a causal claim (Fox News causes worse results on a political knowledge test) from a correlation). Even if we know it to be the case that the test administered was a fair and unbiased measure of political knowledge, then there are still important questions to consider before we jump to causal conclusions. For one, it would be important to look at how many participants took part in the study - if it's too few, the apparent correlation could be the result of fluke chance. The more participants, the less likely chance is the best an explanation. There is also the possibility of reverse causation - e.g., that being less informed on political knowledge caused people to seek out Fox News, rather than the reverse. Sometimes there can even be a causal feedback loop: A causes B causes A causes B and so on, which is yet another possibility to consider when we see a correlation.
So, when you see a correlation, try to remind yourself that you cannot automatically assume a causal link. A correlation is evidence for causation but other possibilities need to be carefully considered.
And there is yet another possibility for why there might be a correlation between A and B even if neither of them cause each other, which is the focus of our next topic...
2. Failing to account for confounding variables
You may have heard news stories about studies purporting to show that a little bit of red wine is good for your health. This causal claim (that a little bit of red wine causes better health) was ubiquitous in the 90s and originally comes from a now famous academic paper that noticed that French people appear to have a relatively low amount of fatal coronary heart disease, despite having a diet with a lot of saturated fats. This was dubbed “The French paradox”. In the years that followed that paper’s publication (and a very successful 60 Minutes segment), the media very quickly latched onto an explanation for it: the French have less fatal heart disease because they drink more red wine.
So, we had an interesting apparent correlation: drinking red wine (because one is French) is apparently correlated with having less coronary heart disease than expected. From this, it was inferred that drinking red wine causes the drinkers to have less coronary heart disease, and various reasons why this might be the case were proposed.
This supposed paradox has spawned a large literature of papers and books talking about it (including many health and wellness books), but it has also garnered a lot of criticism from researchers who point out that there are many ‘confounding variables’ involved.
Confounding variables are hidden influences that affect both of the two variables of interest in a correlation, making it seem like one affects the other when, in reality, it’s really the confounding variable that is affecting both. For example, there might be a strong correlation between ice cream sales and sunburn rates, but buying ice cream doesn’t cause sunburns (or vice versa) — the real culprit is the sunny weather that drives both.
When it comes to the French paradox, there are lots of confounding variables. One study looked at 30 risk factors for coronary heart disease and found that 27 of them (that’s 90%!) were more prevalent in non-drinkers than in drinkers - suggesting that it might not be the lack of wine that makes non-drinkers more prone to coronary heart disease; it could be any number of those underlying risk factors among non-drinkers (which included lack of leisure time, blood cholesterol levels, asthma, and more). Why on earth would non-drinkers have more risk factors, though? It's hard to say, but one theory is that people who are in very poor health avoid drinking because they can't handle it in that condition - and that causes a correlation between not drinking and bad health.
To avoid this trap, always look for other factors that might be at play and reflect on whether they could be influencing or underlying the correlation.
If you want to hone your skills of thinking critically about claims made in academic papers or media reporting, it is helpful to practice thinking of hidden variables that authors may have missed. That is one common way that such articles get criticized by savvy critics.
Ultimately, the French paradox may not be a paradox at all. Further investigation reveals that French doctors were more likely to record heart-related deaths as “unclassified” coronary events than doctors in many other countries, artificially leading to a lower number of deaths attributed to coronary heart disease. This undermines the premise that France has a lower rate of death by heart disease in the first place, and therefore undermines the paradox (and, by extension, evidence that red wine is good for you).
3. Overstating the strength of weak correlations
Frustratingly, a lot of science journalism simply reports that there is a correlation between phenomena, without telling us the strength of that correlation. This means it can be hard to spot when people are overinterpreting weak correlations, seeing connections where there might be little to none. And, to make matters more difficult, the same correlation value can be ascribed different strengths in different fields of study; for example, a correlation of 0.7 may be considered ‘Strong’ in psychology, ‘Very strong’ in politics, and ‘Moderate’ in medicine.
To illustrate this, professor Haldun Akoglu compiled a table of strength attributions for different correlation values, according to widely-used resources in different fields. We’ve recreated it here:

(Note: these are strength attributions for Pearson correlation coefficients.)
Even these rules of thumb are just that - rules of thumb. Within a given field, sometimes a small correlation will be useless and sometimes it will be important. Context matters!
That's why it's important to consider correlation strengths. Try to find out the magnitude of the value of correlations, when you encounter them, and think about what this means in its context (including field of study and specific topic in that field). A weak correlation might not be worth much consideration, especially when making decisions based on the data. But in some cases a small correlation might matter a lot: for instance, a firm discovering a small (but very reliable) correlation in stock trading could yield a successful investment strategy. Context has to be considered to say what's too small to matter.
4. Assuming correlations apply universally
Sometimes people assume that a correlation found in one context applies everywhere, but correlations can vary across different groups, environments, or situations. This sometimes has very severe consequences.
For instance, our understanding of symptoms that correlate with heart attacks largely comes from studies on men, but the symptoms that correlate with heart attacks in women are different enough to cause concern when relying on this research. Symptoms more commonly found in women can end up being misattributed to things like arthritis and diabetes, leading to less recognition of heart attacks in women.
Similarly, the behavioral correlates of autism appear to be different in men and women, but our common cultural conception of autism is mostly informed by how it appears in men. This might lead to underdiagnosis in women, and a lack of understanding of how autism manifests in women (which can also lead to autistic women’s exclusion from early access interventions).
The lesson here is that it is important to reflect on the limitations of the applicability of any given correlation. Be cautious about generalizing correlations from one study or context or group to a broader population.
Correlations are often very useful. They tell us if one thing tends to rise (on average) as another one rises, which is often something we want to know. But, as we've discussed here, they should be interpreted with caution.
Understanding these common pitfalls will help you think more critically about correlations and avoid being misled by superficial relationships. Remember to:
Not confuse correlation and causation
Try to account for confounding variables
Consider magnitude of the correlation and the sample size
Reflect on how widely applicable the correlation is
By being aware of these ways to improve your thinking about correlations, you’ll be better equipped to think critically, interpret data accurately, and make more informed decisions.
Want to see how well you know human psychology? Try our Predicting Correlations quiz!
See if you can predict correlations between answers to different psychological survey questions.


